Biomedical data fusion via sequence alignment—Part 1
It is a recurring theme in bioengineering where it is required or highly desired to merge data from multiple sources of information. This can be data from different sensors monitoring the same event, or the resulting data from applying different methodologies to extract features from a biological signal. Either way, we have a set of time-series data and we want to assess the amount of similarity between them and merge their information together. An important step to measure the similarity between different data sequences is to draw a correspondence between their elements, or in other words, to align the sequences with each other. In this and the upcoming post, I will discuss a simple method that can be used solely or prior to data fusion techniques to significantly improve the results of your data merging pipeline.
The idea is very simple and comes from DNA sequence alignment, where different DNA strands are compared to identify regions of similarity between them. The underlying algorithm for sequence alignment defines a set of penalties for occurrence of a mismatch, a gap, or a match at corresponding positions of the aligned sequences. This can be explained much easier with an example. Consider two DNA sequences “AGGGGGCT” and “AGGGCA”; one possible alignment between the two strands is:
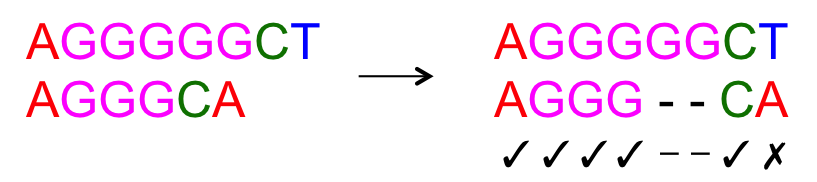
The aligned sequences have 5 matches, 1 mismatch and 2 gaps (nucleotides in one sequence that are not matched with any nucleotides in the other sequence). If we set penalties for occurrence of mismatches, gaps and matches to , , and , then the total cost for aligning these two sequences is .
Once penalties are set, Dynamic Programming is used to find the optimal sequence alignment that minimizes the total cost.
At this point, you might be wondering how we can apply this technique for aligning two time-series data? The answer lies in appropriate definition of penalties. In most applications dealing with time, two measurements are considered to be matched if they are close enough to each other; i.e., their time difference is less than a threshold . Using the threshold parameter (which can be defined and set based on the application), we choose the penalties to be , and . In other words, any two matched time points contribute to the total cost by a weight proportional to their time difference, and any time point reported in only one sequence and missed by the other contributes to the cost by a weight of +1. Notice how contains both and definitions within itself.
With this penalty function we can use the same Dynamic Programming that is used for DNA sequence alignment (sometimes referred to as the Needleman-Wunsch algorithm), for aligning two time-series data. The pseudocode in the Wiki page describing Needleman-Wunsch is pretty self-contained for implementing the algorithm in your favorite programming language.
Using Dynamic Programming for comparing similarity of two sequences might seem an overkill, but the power of this technique becomes more obvious for comparing more than two sequences. You might have simple heuristics for comparing a sequence with its corresponding gold standard, e.g., but I’m pretty sure you’ll agree with me that those heuristics won’t work or will have very large time complexities when applied to more than two sequences. That is why I strongly recommend you to read my next post on multiple sequence alignment as well.